
Infrared Thermography Services for Advanced Thermal Diagnostics

Whether you’re managing electrical infrastructure, monitoring mechanical systems, or investigating unexplained equipment issues, infrared thermography provides diagnostic intelligence that visual inspections simply cannot deliver. For facility managers and engineers across the Atlanta area, it’s predictive intelligence that actually predicts.
At Shaw Consulting Services, we provide infrared thermography services that combine advanced thermal imaging technology with experienced analysis to give you actionable insights about your facility systems.
Overview of Infrared Thermography
Infrared thermography is a non-contact diagnostic technique that uses specialized thermal imaging cameras to detect, measure, and visualize infrared radiation emitted by objects and equipment. All objects above absolute zero emit infrared energy invisible to the human eye but detectable by thermographic cameras.
These cameras convert infrared radiation into visual thermal images called thermograms, where different temperatures appear as different colors or grayscale values.
Temperature variations reveal conditions like electrical resistance, mechanical friction, insulation defects, moisture intrusion, or airflow problems, issues that have distinct thermal signatures but might be completely invisible during visual inspection.
The power of thermography lies in its ability to identify anomalies during early developmental stages. That electrical connection is gradually loosening, that bearing is beginning to fail, that insulation gap is allowing energy loss, and thermography catches these issues when they’re still minor problems requiring simple interventions rather than major failures requiring emergency response.
Infrared thermography is completely non-invasive and non-destructive. We can inspect energized electrical systems, operating mechanical equipment, and building envelope components without shutdowns, physical contact, or any disruption to normal operations.
")
")
Difference Between Thermography & Visual Inspections
Visual inspections rely on what you can see with the naked eye, such as physical damage, discoloration, corrosion, or other obvious indicators of problems. These inspections are valuable but fundamentally limited. By the time electrical connections show visible discoloration, they’ve been overheating for extended periods. When mechanical bearings make an audible noise, they’re already in advanced failure stages.
Infrared thermography reveals problems long before visual symptoms appear. We identify:
Hidden Electrical Issues, like loose connections, internal breaker failures, and imbalanced loads, show no external signs of distress. The panel looks fine visually, but thermography reveals one phase running 60 degrees hotter than the others.
Early Mechanical Failures in motors, bearings, couplings, and drives where increased friction from wear or misalignment creates detectable heat rise before vibration or noise develops.
Building Envelope Defects, including missing insulation, air leakage paths, and moisture intrusion that visual inspection would miss entirely. You can’t see the insulation gap inside a wall, but thermography shows the thermal signature clearly.
Process & System Inefficiencies, like blocked heat exchangers, plugged filters, or improper fluid levels, that affect thermal performance without obvious visual indicators.
The technical difference is fundamental: visual inspection detects what has already degraded to visible failure stages. Thermography detects what’s beginning to fail while correction is still simple and inexpensive.
Key Applications of Infrared Thermography
Electrical System Diagnostics represent the most common thermography application. We identify overheating connections, overloaded circuits, failing breakers, imbalanced phases, and deteriorating components throughout electrical distribution systems from the utility service entrance through final branch circuits.
Mechanical System Analysis includes rotating equipment monitoring (motors, pumps, fans, compressors), bearing condition assessment, coupling and belt drive alignment verification, gearbox condition monitoring, and steam trap functionality testing.
Building Envelope Surveys reveal insulation deficiencies, air infiltration and exfiltration points, moisture intrusion in walls and roofs, thermal bridging in construction assemblies, and HVAC ductwork leakage.
Process Equipment Monitoring for industrial facilities includes furnace and boiler refractory condition, heat exchanger performance, tank levels and contents, piping insulation effectiveness, and process vessel temperature uniformity.
Facility Maintenance Programs integrate thermography for comprehensive condition monitoring, trending equipment performance over time, verifying repair effectiveness, and supporting predictive maintenance strategies.
Energy Audits leverage thermography to identify energy waste, verify insulation installation, locate air sealing opportunities, and document conditions for efficiency improvement projects.


Our Thermography Process
We follow a systematic methodology ensuring accurate, reliable, and actionable results:
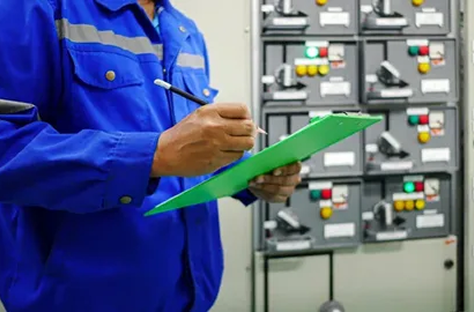
Pre-Survey Planning involves understanding your diagnostic objectives and questions requiring answers. We review facility systems and equipment requiring assessment, identify optimal timing for representative operating conditions, and coordinate access requirements. For electrical systems, we need equipment energized and preferably under at least 40% load. For mechanical systems, we need normal operating conditions with equipment running.
Field Data Collection includes systematic scanning of target systems and equipment with calibrated infrared cameras, capturing thermal images and corresponding visible-light reference photos, documenting equipment identification and specific locations, and recording operating conditions, ambient temperatures, and environmental factors affecting thermal readings.
Analysis & Interpretation applies our engineering experience to thermal data. We analyze temperature distributions and identify anomalies, compare similar components to establish normal baseline conditions, evaluate severity based on temperature differentials and equipment type, and correlate thermal patterns with known failure modes and operational issues. This expert interpretation separates concerning findings from normal variations.
Documentation & Reporting provides comprehensive deliverables with thermal images paired with visible photos for context, temperature measurements, and severity assessments, specific location identifiers for findings, prioritized recommendations with corrective action guidance, and trend analysis if historical data exists from previous surveys.
Reporting & Analysis Provided
Your infrared thermography report includes:
Executive Summary highlighting key findings, critical issues requiring immediate attention, and overall system condition assessment.
Detailed Findings with high-resolution thermal images, corresponding visible photographs, measured temperatures and temperature differentials, equipment identification and location details, and severity classifications (critical, major, minor).
Technical Analysis explaining thermal patterns observed, comparison to normal operating signatures, discussion of probable causes, and implications for equipment reliability and safety.
Recommendations providing prioritized corrective actions, suggested response timeframes, guidance on repair or replacement decisions, and preventive measures to avoid recurrence.
Trend Data when conducting follow-up surveys, showing whether conditions are improving, stable, or deteriorating compared to previous inspections.
Reports are delivered digitally with full-resolution images suitable for engineering review, insurance documentation, or maintenance work order generation.

Industries & Systems Served
We provide infrared thermography services across diverse sectors

Manufacturing & Industrial
Facilities benefit from comprehensive electrical and mechanical equipment monitoring, supporting predictive maintenance programs, and minimizing unplanned downtime.

Commercial Real Estate
Uses thermography for building envelope assessment, energy efficiency evaluation, and electrical system condition monitoring across office buildings, retail centers, and mixed-use developments.

Healthcare Facilities
Require reliable electrical and mechanical systems where thermography supports critical infrastructure maintenance and patient safety requirements.
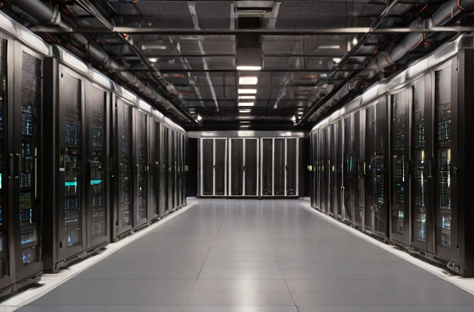
Data Centers
Depend on electrical reliability, where thermography identifies issues before they cause costly outages or equipment damage.
Educational Institutions
Educational Institutions Managing aging infrastructure use thermography for capital planning and preventive maintenance prioritization.

Property Management
Companies leverage thermography for tenant issue investigation, pre-purchase due diligence, and ongoing building system maintenance.
Atlanta-area facilities with aging systems or deferred maintenance particularly benefit from thermography’s ability to assess current conditions and prioritize limited maintenance budgets toward the highest-impact interventions.

Standards & Best Practices
Our thermography services align with industry standards and best practices:
ASNT SNT-TC-1A provides guidelines for thermographer qualification and certification. Our thermographers maintain appropriate training and certification levels.
NFPA 70B recommends annual infrared inspections for electrical distribution systems as part of comprehensive maintenance programs.
ASTM Standards, including ASTM E1934 (building envelope thermography) and ASTM E1933 (moisture detection), guide our building assessment methodology.
ISO 18434-1 addresses thermography for condition monitoring and diagnostics of machines.
IEEE Standards inform our electrical system thermography approach, particularly for interpreting thermal patterns in power distribution equipment.
We stay current with evolving standards and emerging best practices through ongoing professional development and industry engagement.
FAQ’s
How accurate is infrared thermography?
Do you provide interpretation or just images?
When is the best time for thermography surveys?
Can thermography see through walls?
How often should we conduct thermography surveys?
Why Choose Shaw Consulting Services
Thermography cameras are tools; the value comes from experienced interpretation. We bring electrical and mechanical engineering knowledge to thermal analysis, understanding what we’re looking at and why it matters. Our reports don’t just show hot spots; they explain root causes, assess risk levels, and provide maintenance teams with clear direction on what needs attention first.
We’ve worked with facilities across Atlanta, dealing with everything from vintage electrical systems in historic buildings to modern high-density data centers. That breadth of experience means we recognize patterns quickly and provide recommendations grounded in real-world implementation, not just textbook theory.
Ready to see what’s invisible to visual inspection? Request infrared thermography services from Shaw Consulting Services today. Contact us to discuss your diagnostic needs and schedule your thermography survey.